

Chart Series Customization
The different series of a chart can each be individually customized. These customizations include its style, color settings, axis and display position. Users can also elect to hide or show a specific series in a given chart.
Accessing Series Settings
Users can access the series settings by either:
- Right-clicking on the series name in the legend (red arrow below).
- Right-clicking on a specific data point in the chart itself (black arrow below).
In the context menu, users can move the entire series from the primary to the secondary axis (or vice versa) or hide and show a series within a chart. If there is more than one type of chart within the plot area, users can also change the chart order stack. For more advanced settings, users can edit the series in a separate Chart Series Edit Dialog.
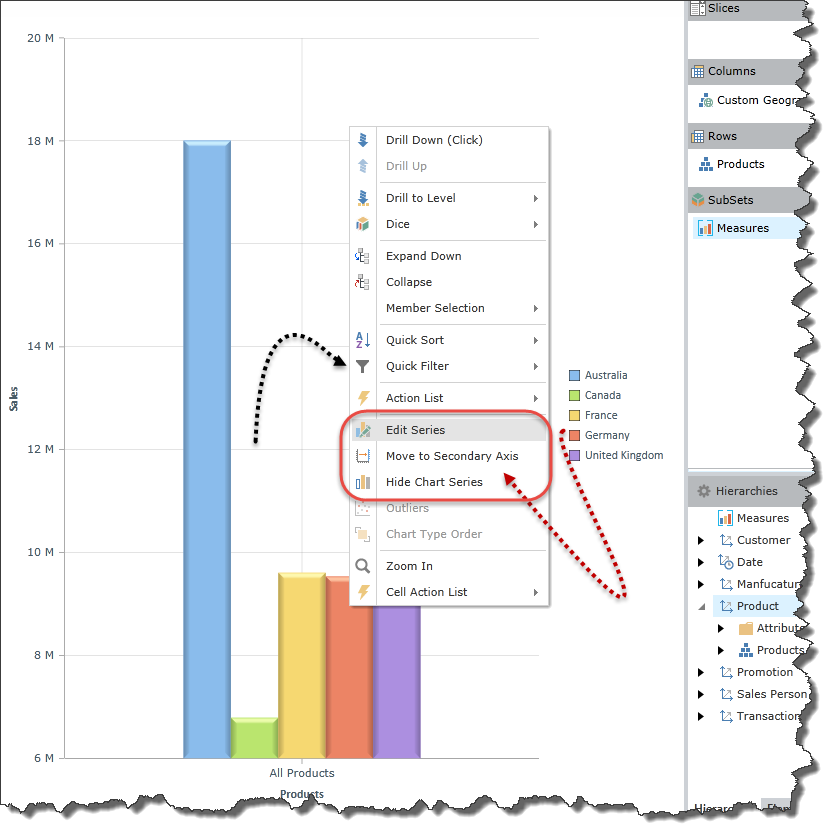
Chart Series Edit Dialog
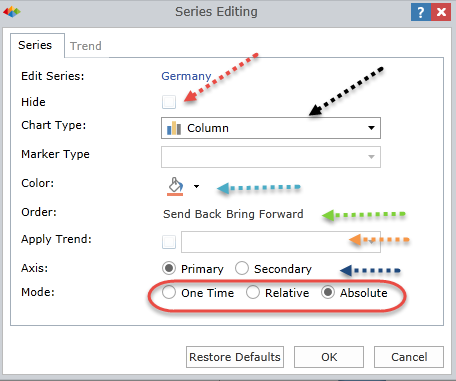
The Series Edit Dialog gives users granular control over a chart series. Users can:
- Elect to hide or show the series within the given chart (red arrow)
- Change the series type (black arrow). Use this option to create combo-charts. Note that not all chart types can be used in a combo-chart.
- Change the color of the series (teal arrow).
- Change its appearance order (green arrow). This only functional when two or more chart types are present in the given chart.
- Create a trend line chart for the series (orange arrow). This is only functional on certain chart types.
- Specify on which Y-axis to plot the data: primary or secondary (blue arrow).
- Specify under which mode these changes should apply (red highlight). See details below.
Change Mode
The series change mode allows the user to capture how the series customization should operate within the report.
- One Time - Changes are applied to the current series as is. If the query in the report is changed, the customizations are lost. This includes drill down, slicing, dicing etc.
- Relative - Changes are applied permanently to the current series in this report. However the changes will always apply to whatever data set is in the current series *position*. For example, the changes are made to series number 4. So these settings will apply to number 4 series in the query, irrespective of what it is. Therefore, if a user slices, dices or drills in the query, the #4 series will always have these customizations.
- Absolute - Changes are applied permanently to the current series in this report. However the changes will only apply to this specific series. For example, if the "Australia" series is set as a blue line chart from a red bar chart, then whenever the data for Australia is plotted in this report it will always show up as a blue line chart. Irrespective of whether the user slices, dices or drills into the data, the Australia data will always show up as a blue line chart.
Home |
Table of Contents |
Index |
User Community
Pyramid Analytics © 2011-2022